Strategy April 24, 2017
Promotional Product State and Regional Sales Report
A look inside the state of sales in the promotional product industry.
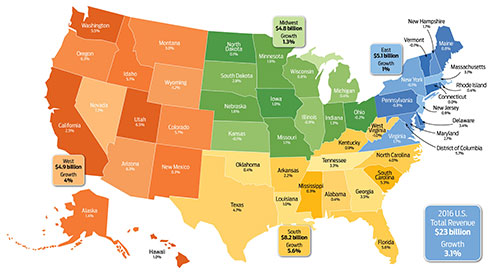
Numbers always tell a story, but maybe not the full story. It pays to keep that in mind with the 2017 State & Regional Report. A quick glance will tell you that the South and West are growing while the Midwest and East are treading water. But a peek under the surface tells us more.
Facebook Live
ASI’s Director of Market Research Nate Kucsma joins “Facebook” Vinnie Driscoll for a live discussion of the report. Watch the video below.
South: The largest and most lucrative region set the pace by growing 5.6% last year. And while a handful of other states in the region posted respectable gains (South Carolina, North Carolina and Georgia), the clearest indicators of the region’s growth is also its biggest: Florida (5.6% growth) and Texas (4.7%) account for over $4 billion in promotional product revenue, propping up the region and the national industry.
West: The West grew by 4%, but its story is quite different than the South’s. Seven of the nine fastest-growing states last year could be found in the Mountain and Pacific Time zones, posting growth of 5.5% or better. However, nearly 40% of the region's revenue is tied up in one significant state – California. With modest 2.5% growth, the Golden State exerts a slight drag on the region's optimism.
Midwest: It’s not a good sign when the smallest state by revenue (South Dakota) grows the most while your two largest states (Illinois and Ohio) decline. But while 1.3% growth is certainly nothing to write home about, it does belie the Midwest’s changing nature as it recalibrates to booming sectors and strives to attract younger workers.
East: The East’s 1% growth rate is certainly influenced by the struggles of Pennsylvania, New York and Connecticut. But this tradition-saturated region has pockets of encouraging growth (Washington, D.C., Delaware and Massachusetts) and is still home to lots of Fortune 500 companies and major industries that are still willing to spend.
With each of our regional features, we give you all the relevant data of how the states and regions are faring. But we also go beyond the numbers and speak with distributors in each region to get the deeper story of what’s going on. We’ve presented the major business and product trends you need to know, key stats for each region and a state spotlight for some of the most interesting areas of growth in the country. Grab a map (or maybe your phone GPS) and let’s get started.
Methodology
Revenue estimates are derived from various data, including distributor sales in each state, population trends, health of regional industries, state GDP growth, unemployment rates, census figures and other key economic indicators.
Sponsored Content

Increase Productivity And Enhance Your Customer’s Brand
ANTI-FATIGUE Anti-fatigue mats are a great solution for a variety of applications....

The Perfect Banner For Every Situation
To close a sale, you need to direct your client to the perfect solution for their...
SPONSORED BY:
Wholesale Banners Online

5 Terms That Will Increase Your Performance Workwear Sales
When you present workwear, buyers want to hear how the apparel will perform on the...


